


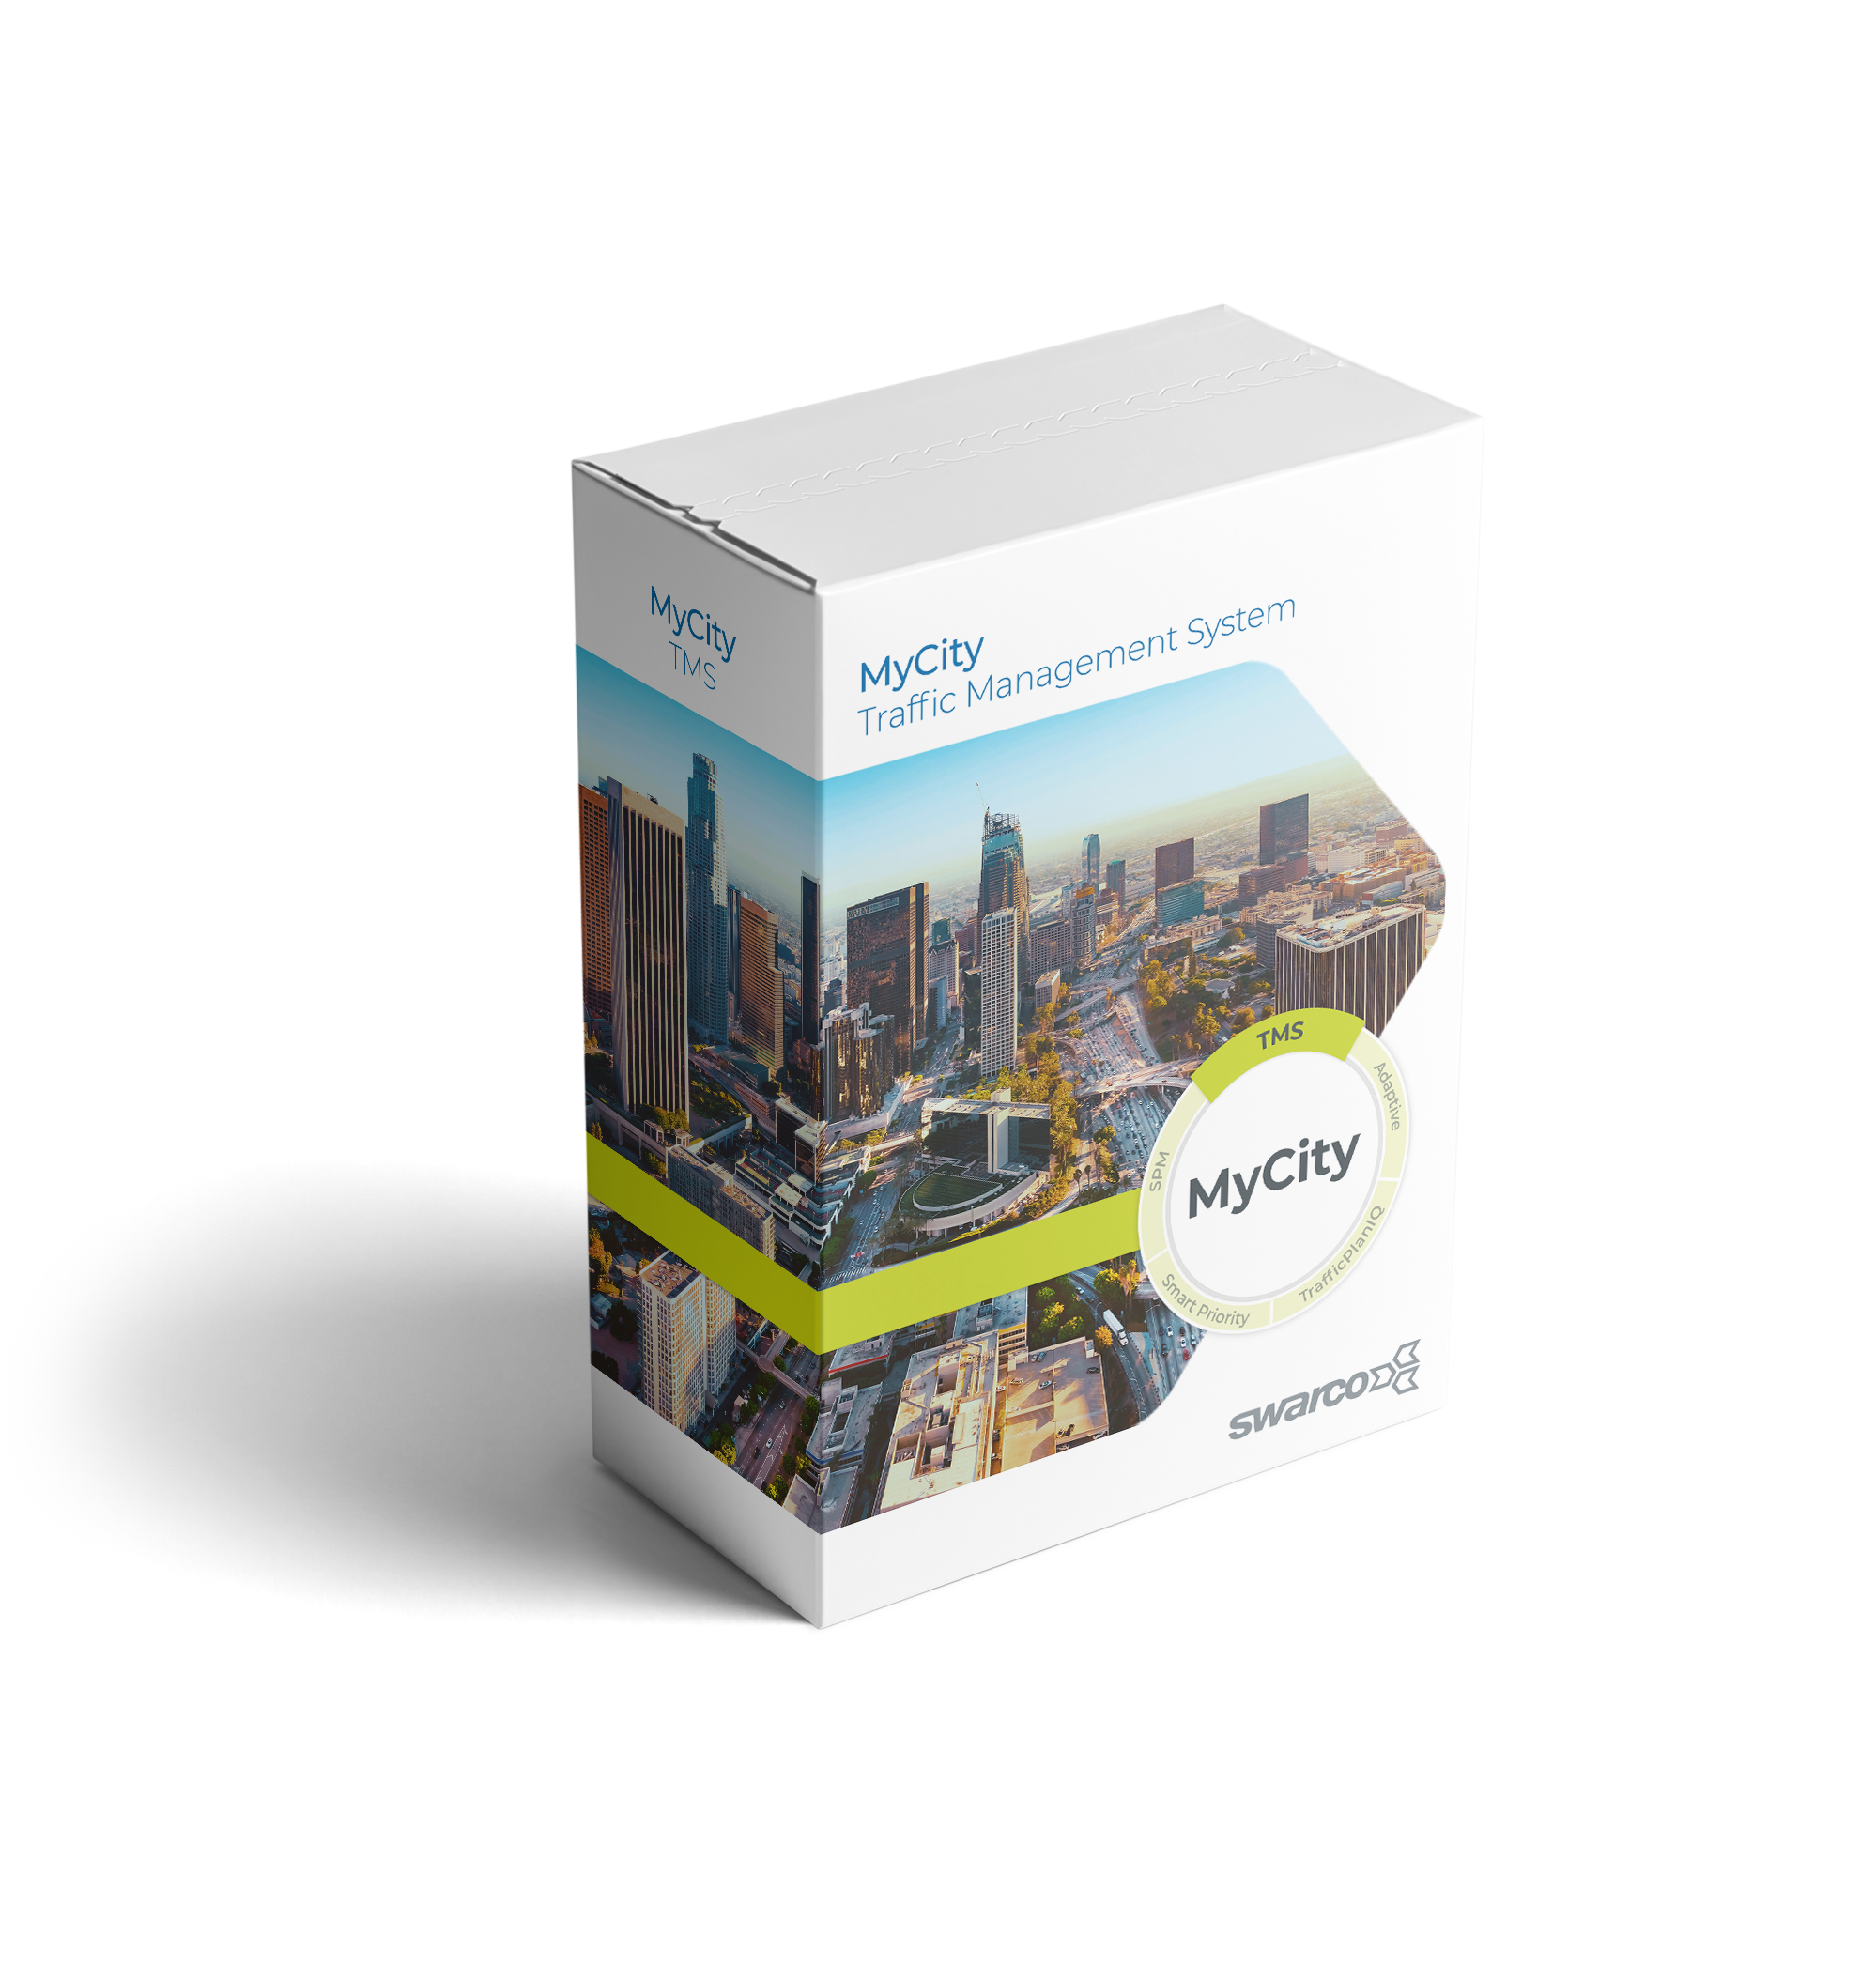
MyCity
Manage traffic flow and promote mobility with real-time traffic data collection and management tools.
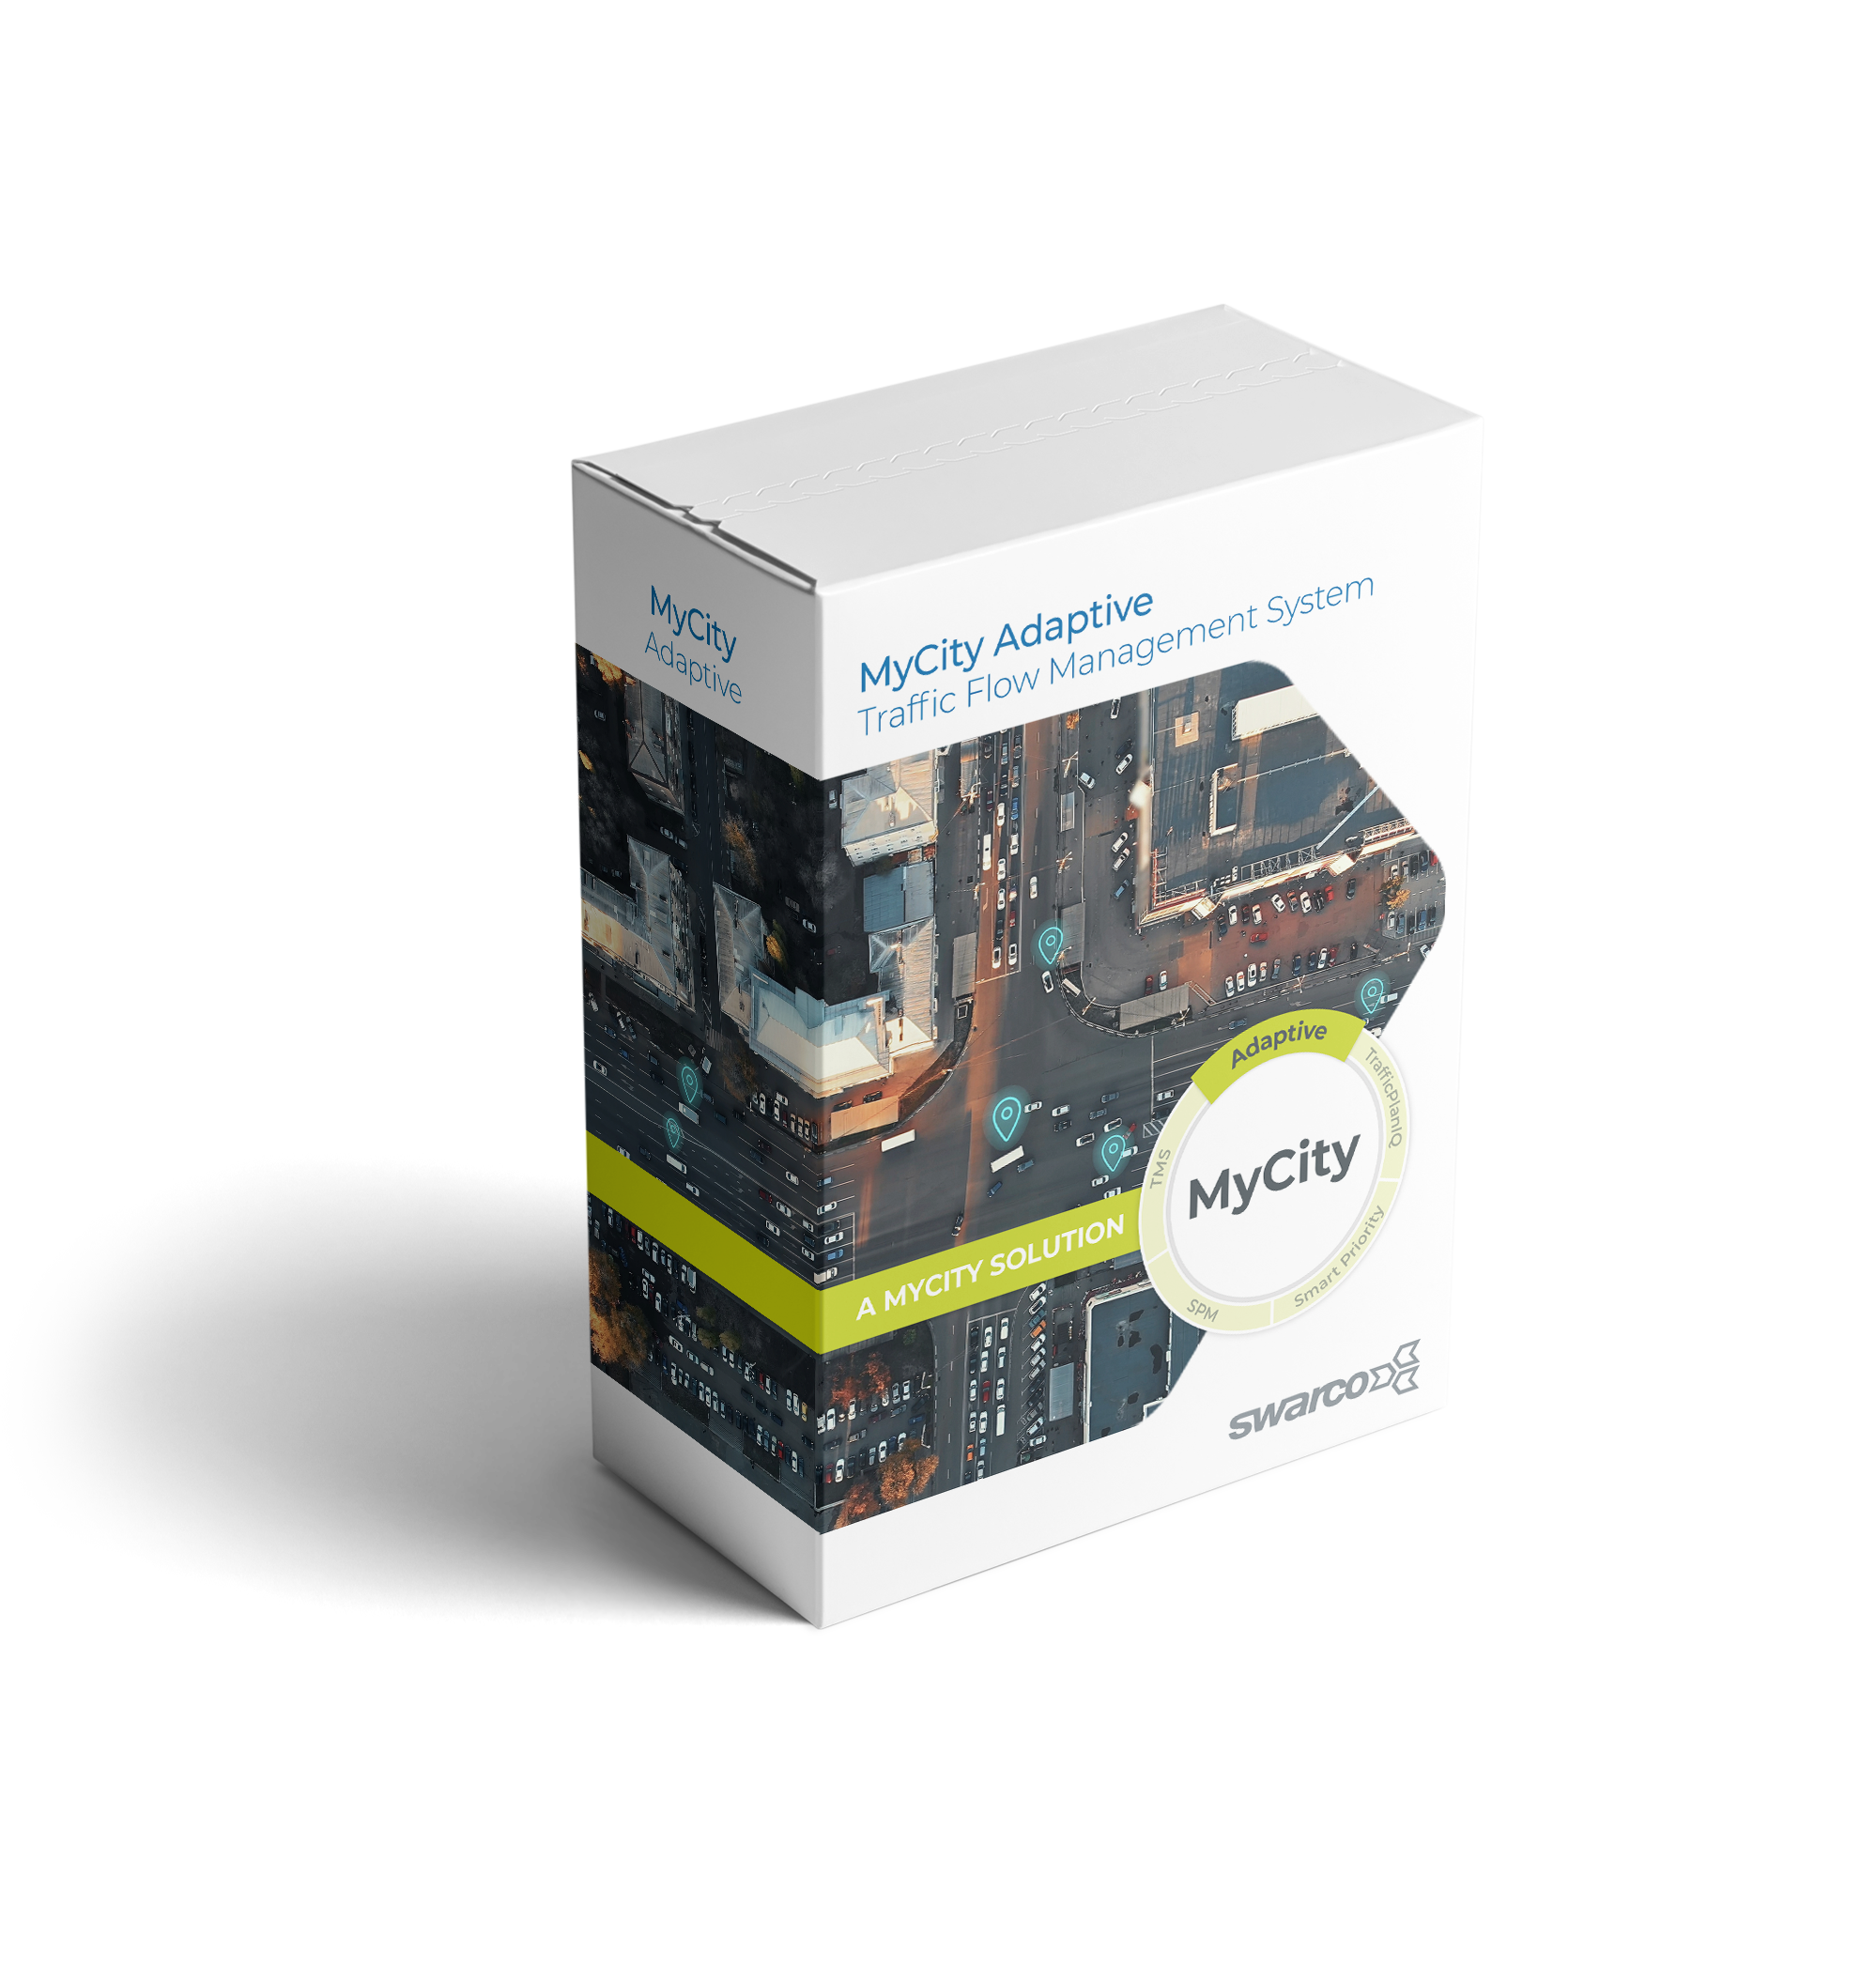
MyCity Adaptive
Improve arterial performance by adjusting to real-time demand on corridors using ATC controllers.
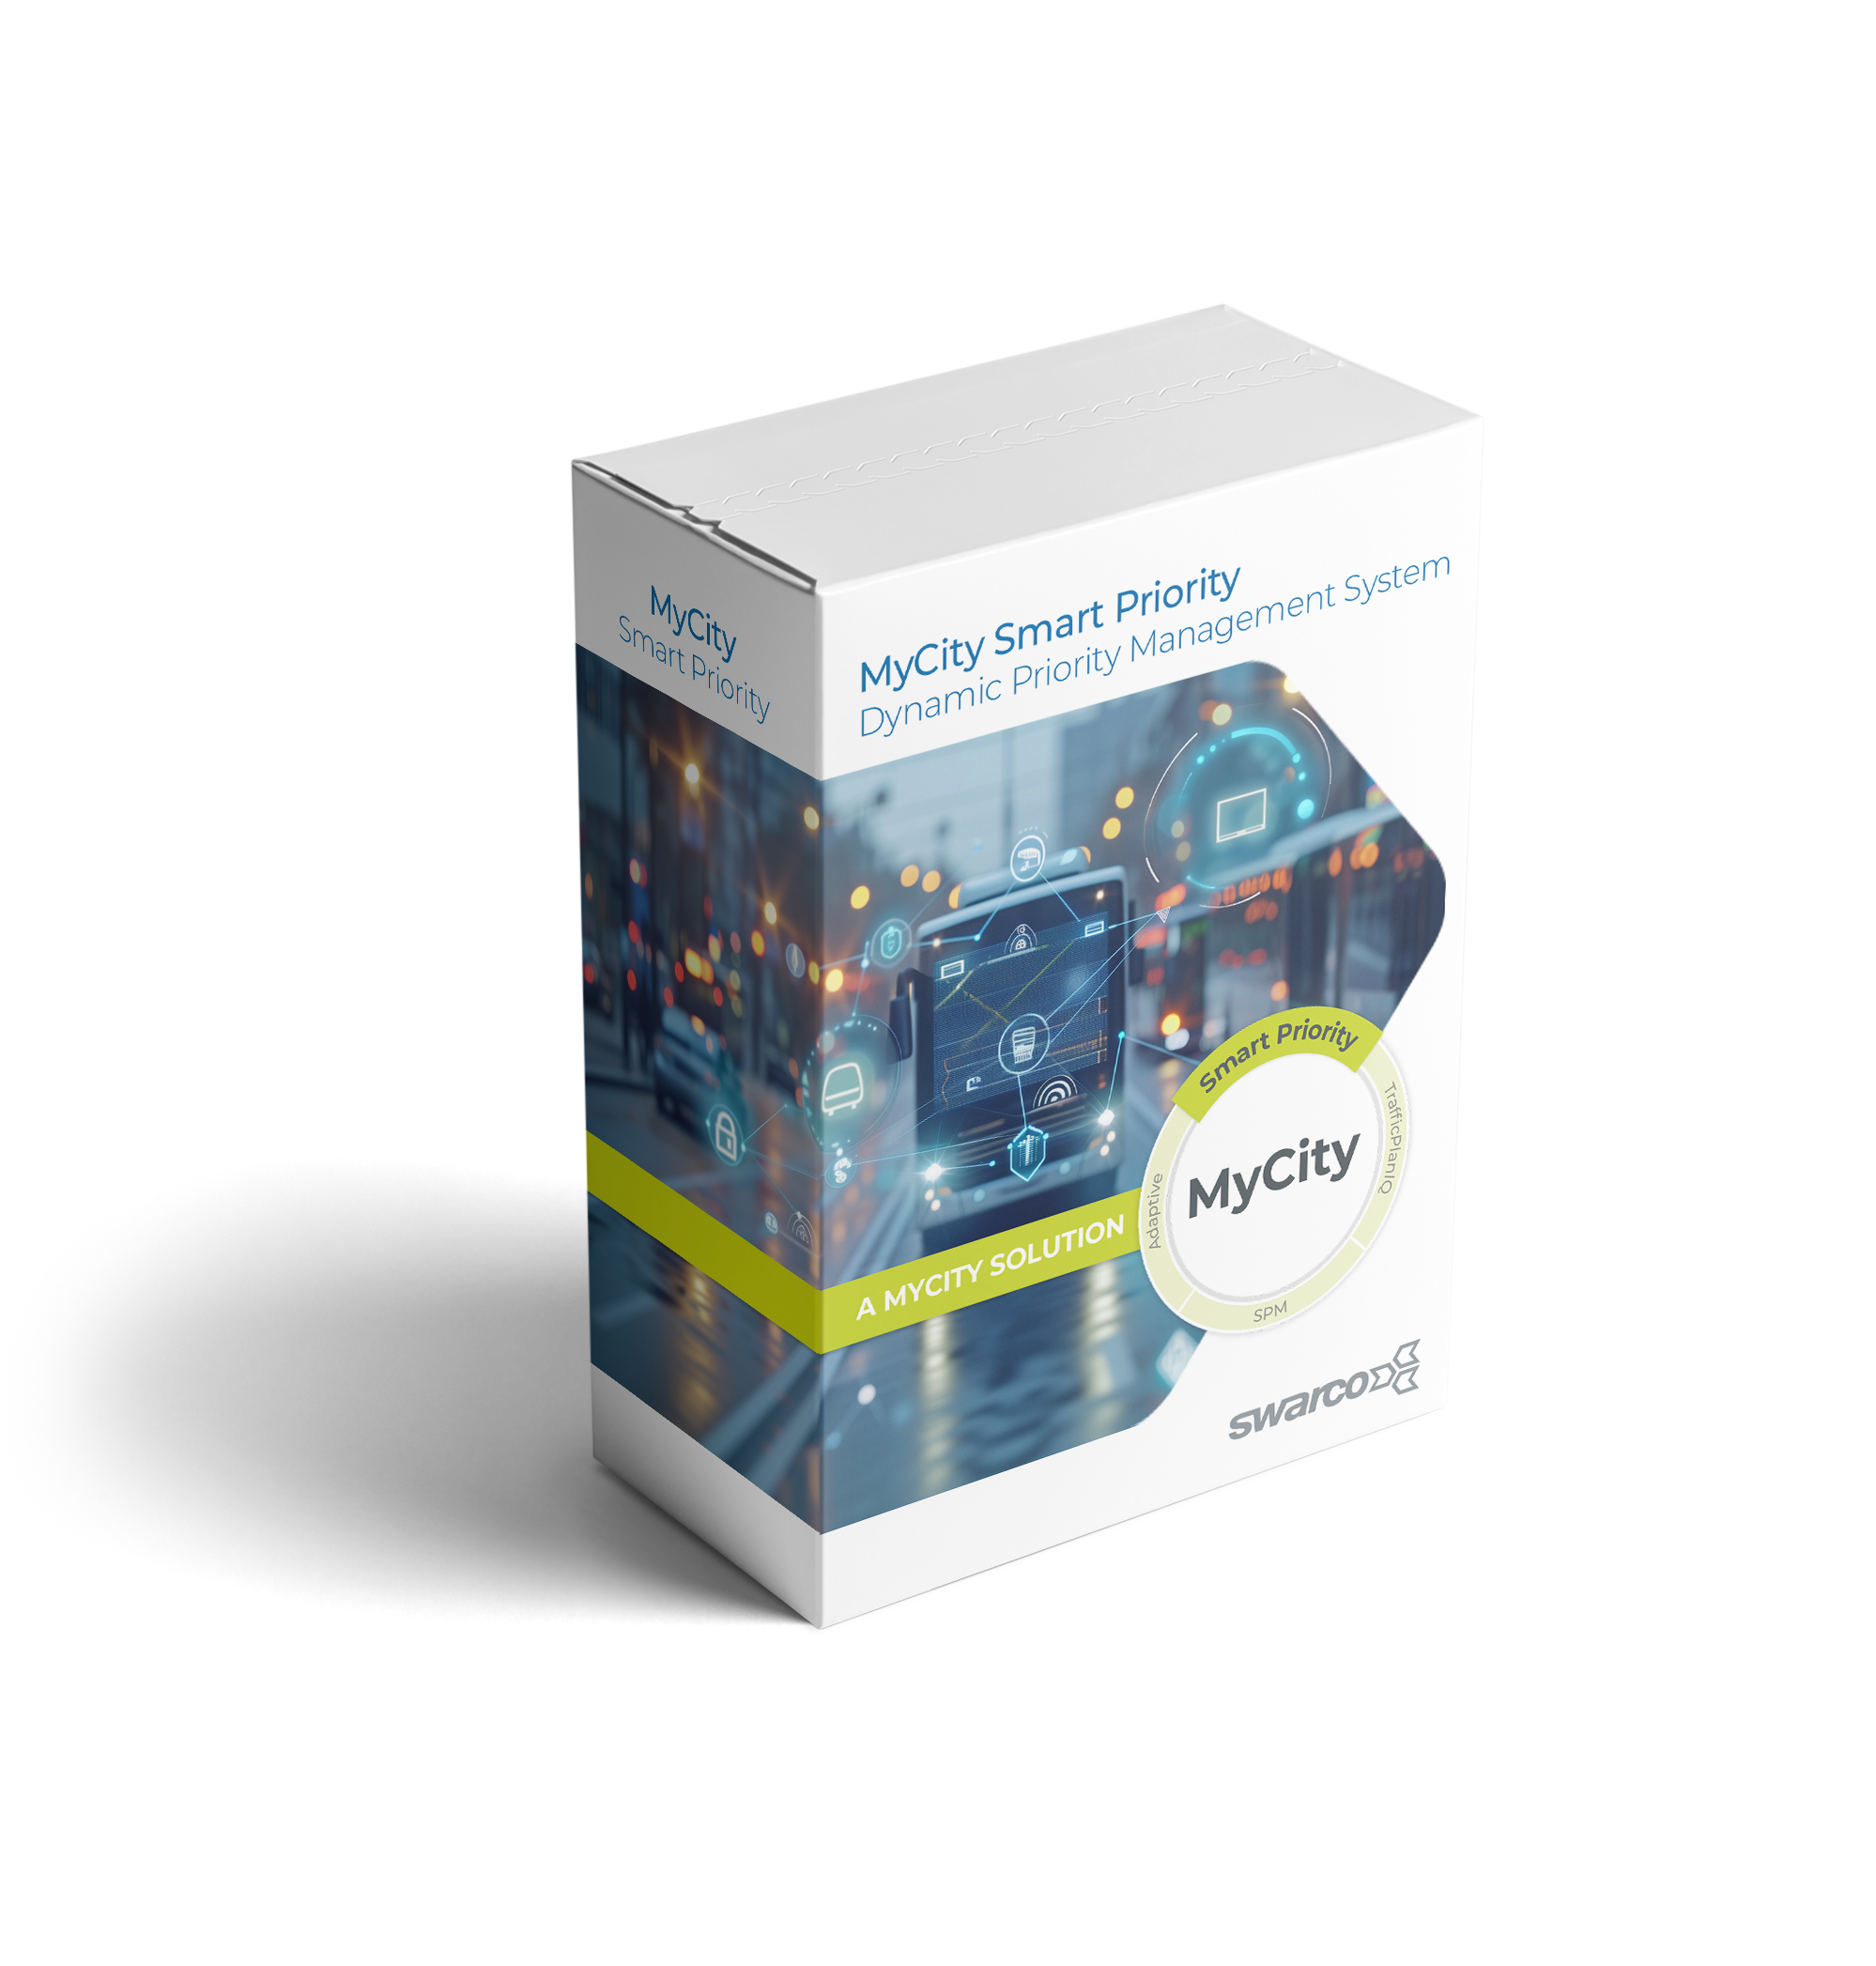
MyCity Smart Priority
Leverage existing infrastructure and optimize traffic flow to reduce travel times and emissions for emergency vehicles and public transportation.
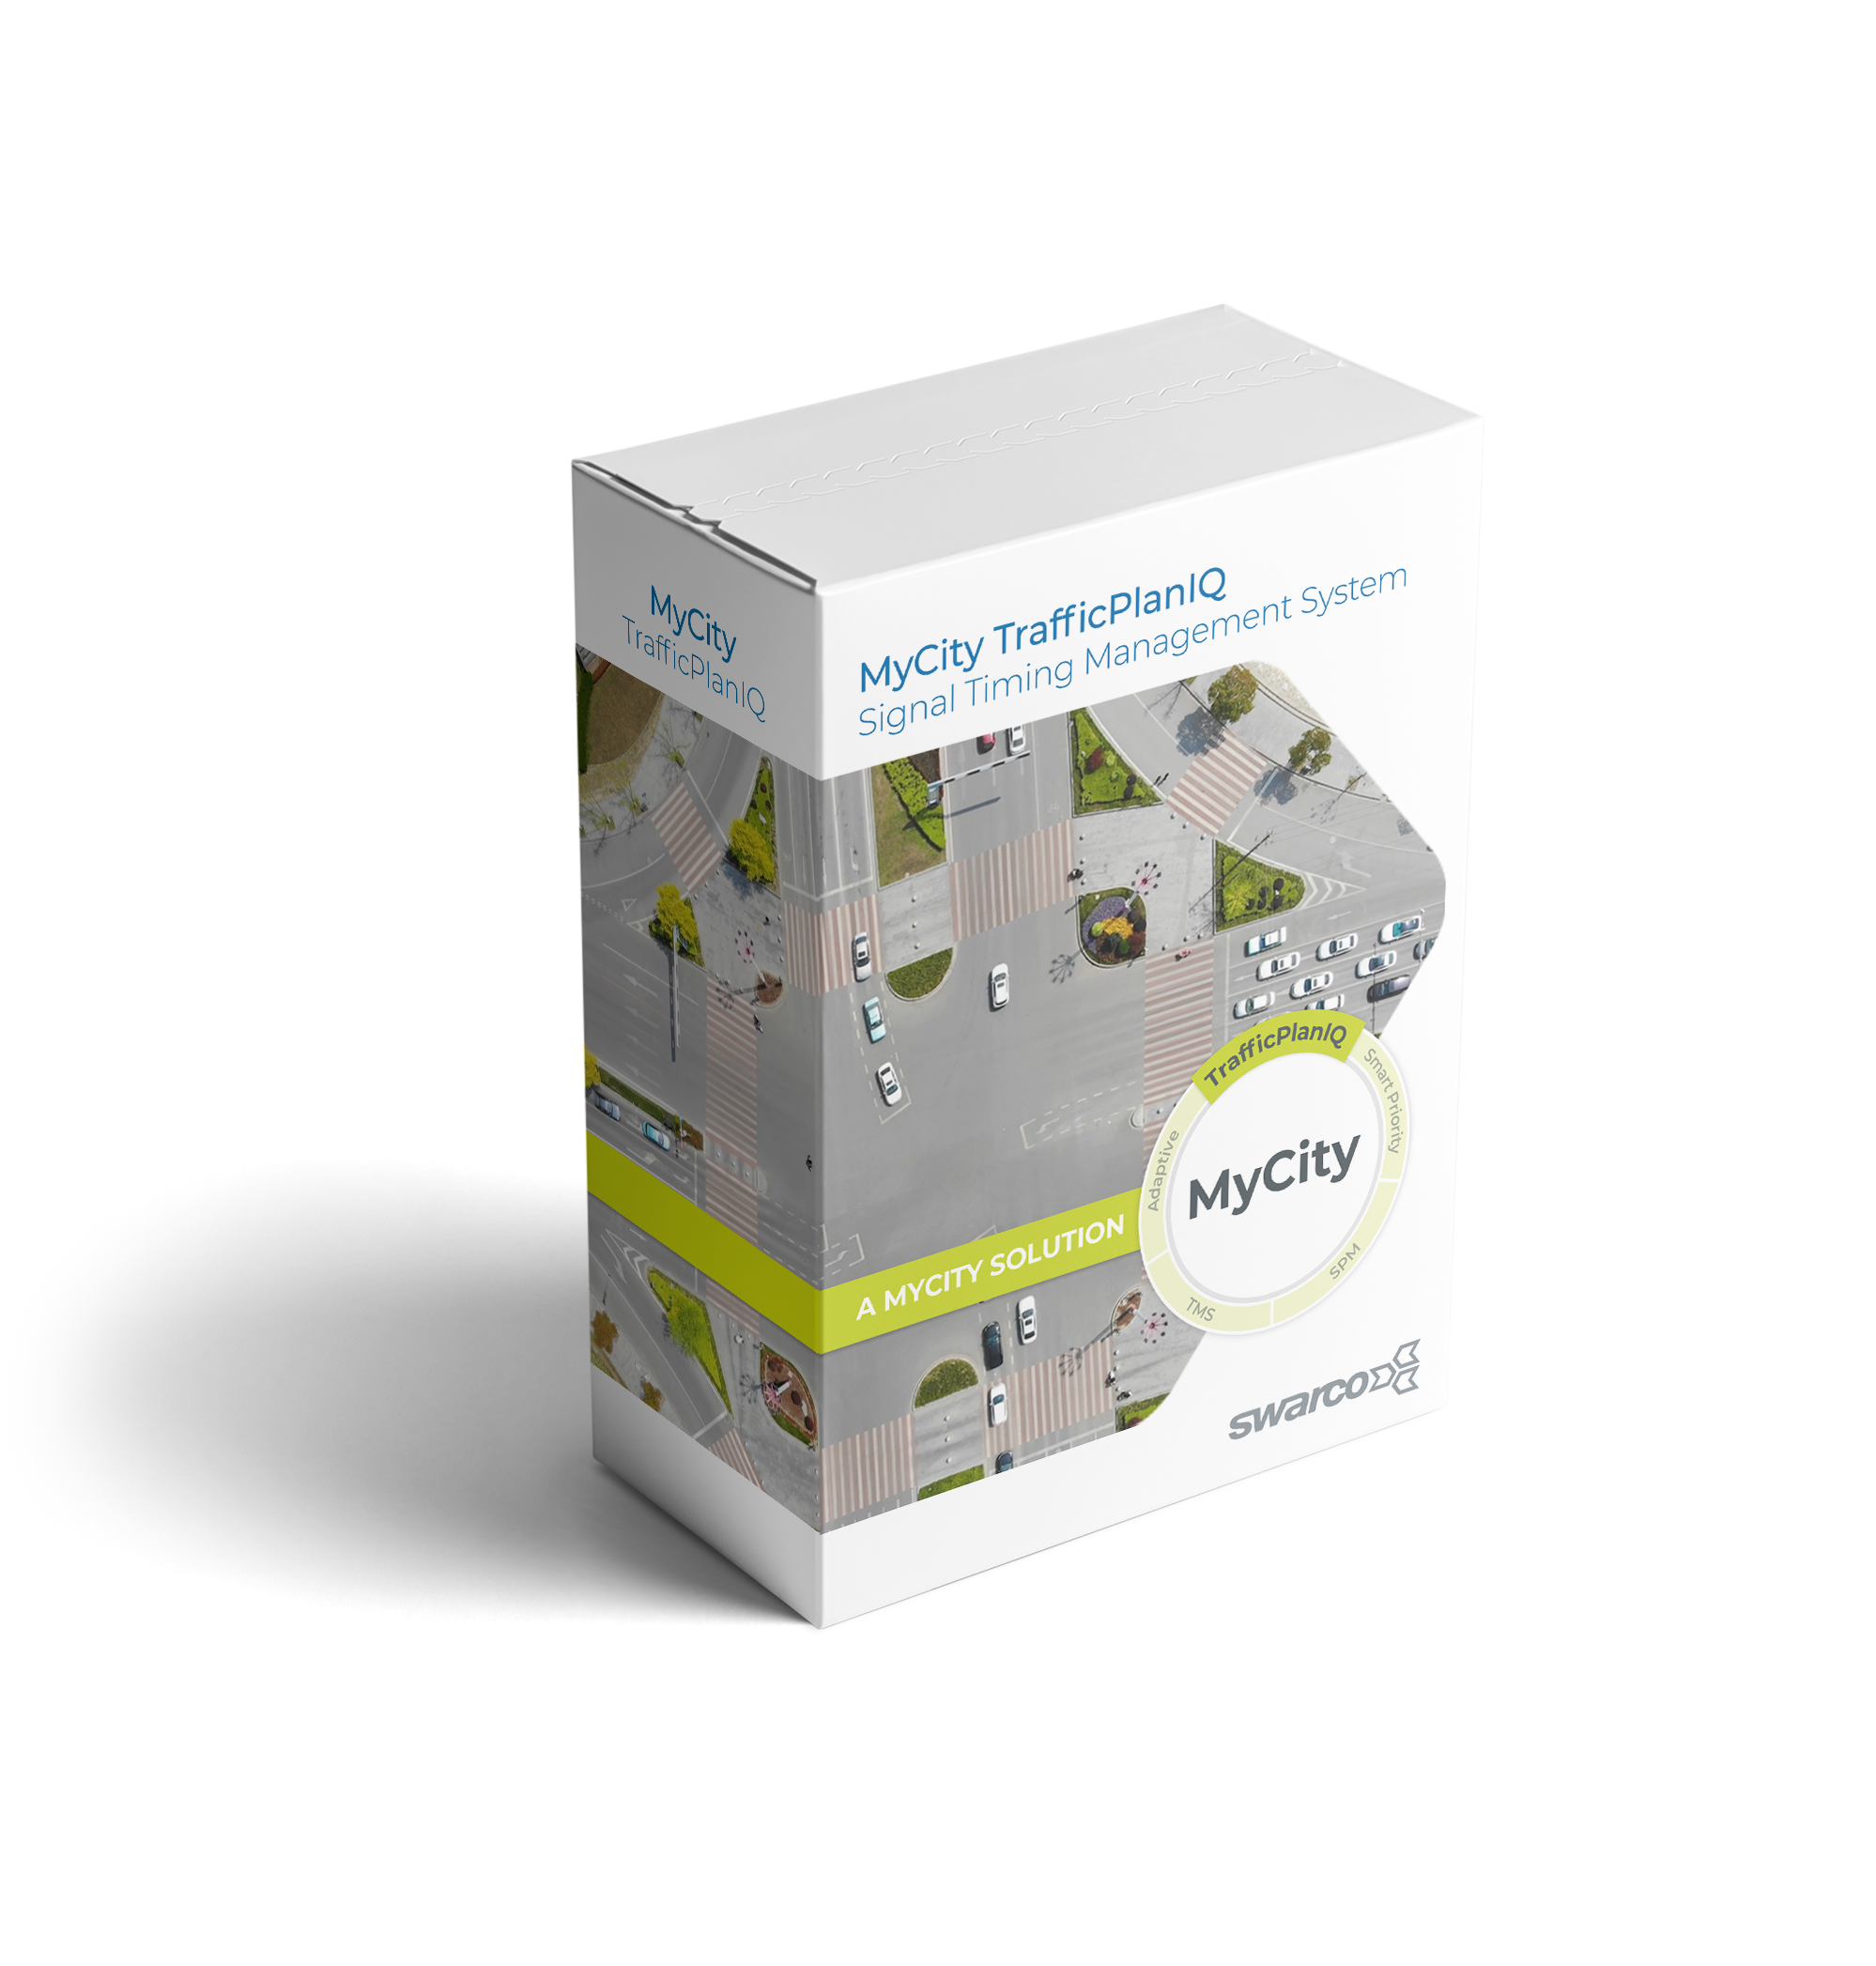
MyCity TrafficPlanIQ
Collect data, generate timing plans, and deploy them to signal controllers with this comprehensive solution.
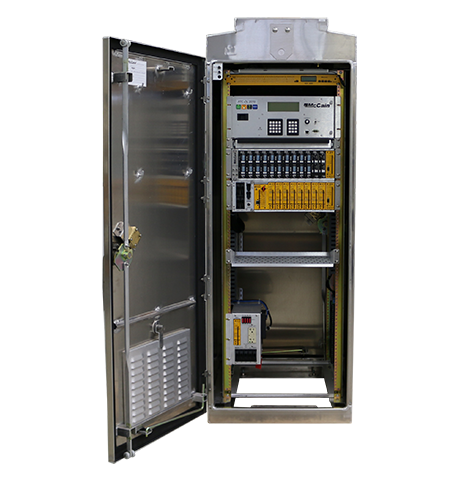
352i ATC Cabinet
Standard-size ATC cabinet for ATC controllers. Manages up to 72 inputs and 32-channel outputs.
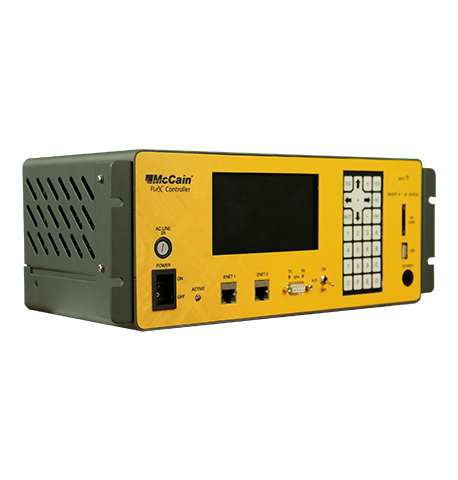
FLeX® Controller
Get superior control with this small but powerful open architecture Linux platform controller.
MyCity TMS
Manage traffic flow and promote mobility with real-time traffic data collection and management tools